Predicts land surface temperature from NDVI, NDBI, elevation, slope and urban density.
Professor-ready frontend prototype
Urban Climate Mapping for Shimla City
A responsive web dashboard for demonstrating machine-learning-based urban heat island, cloudburst-impact susceptibility and climate vulnerability mapping using satellite, terrain, rainfall and urban-form parameters.
Note: Current points are demonstration samples. Replace them with real GEE/GIS CSV outputs for final research.
16
predictive sample points
Heat + Cloudburst Risk Mapping
Ranks sample zones using thermal hazard, built-up pressure and vegetation cooling.
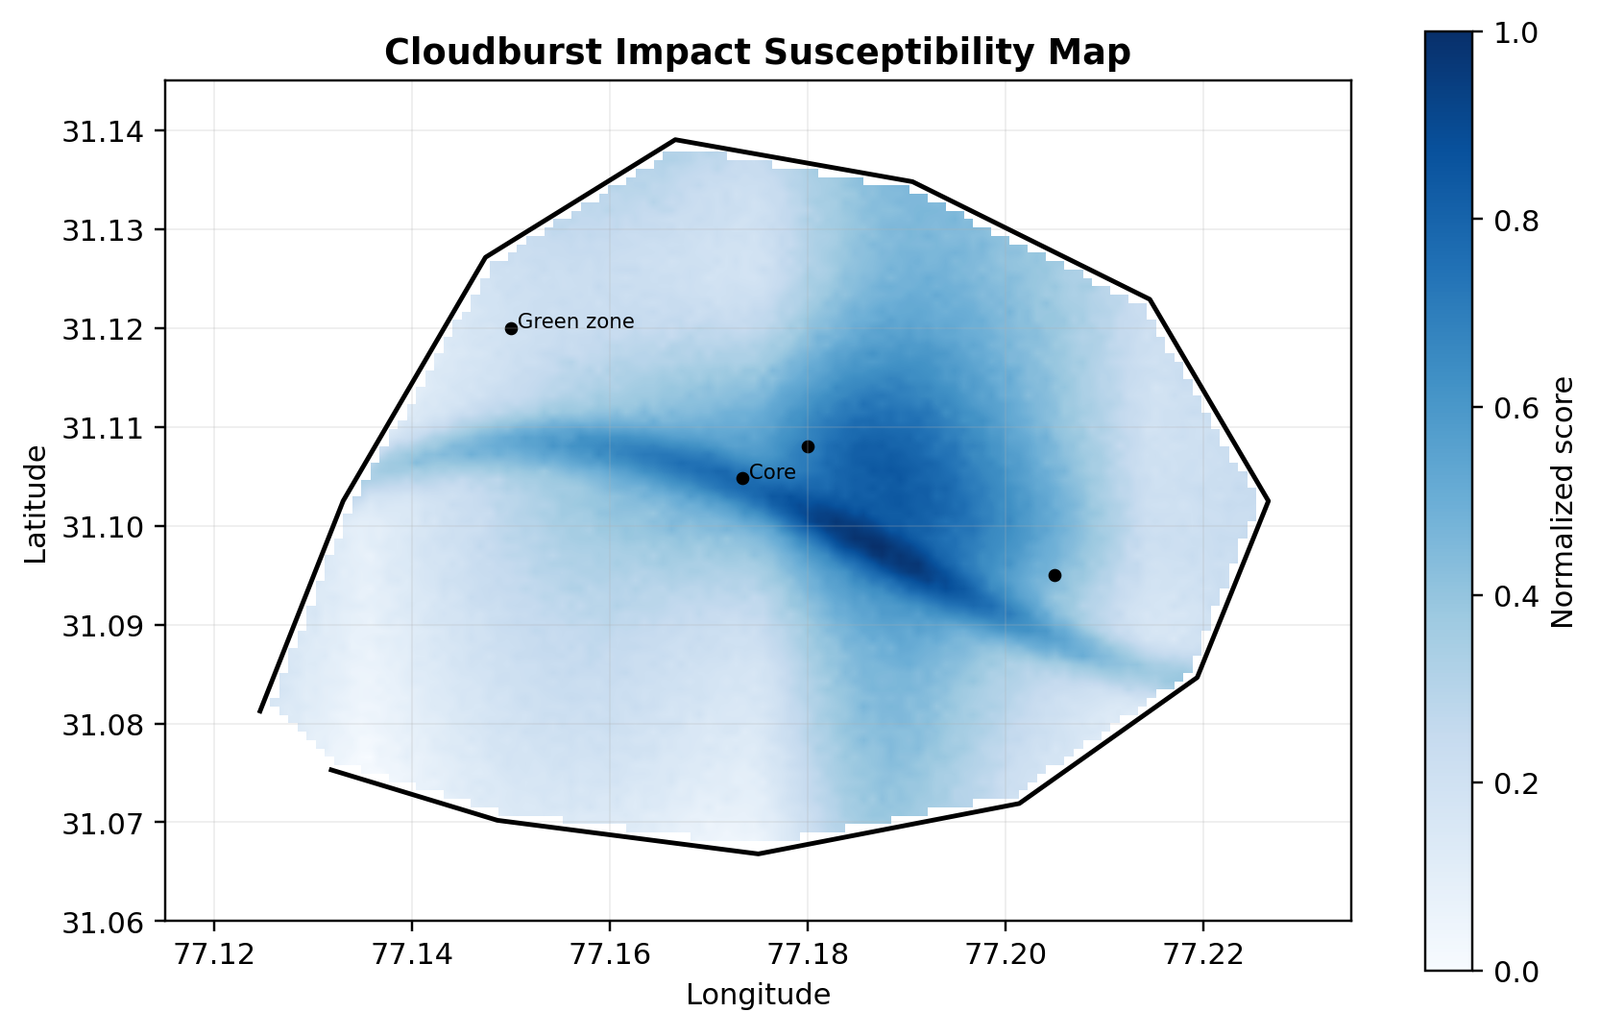
Maps impact-prone zones based on rainfall, slope, flow accumulation and road density.
Interactive web interface for visual assessment and ward/grid-level prioritization.
Research model
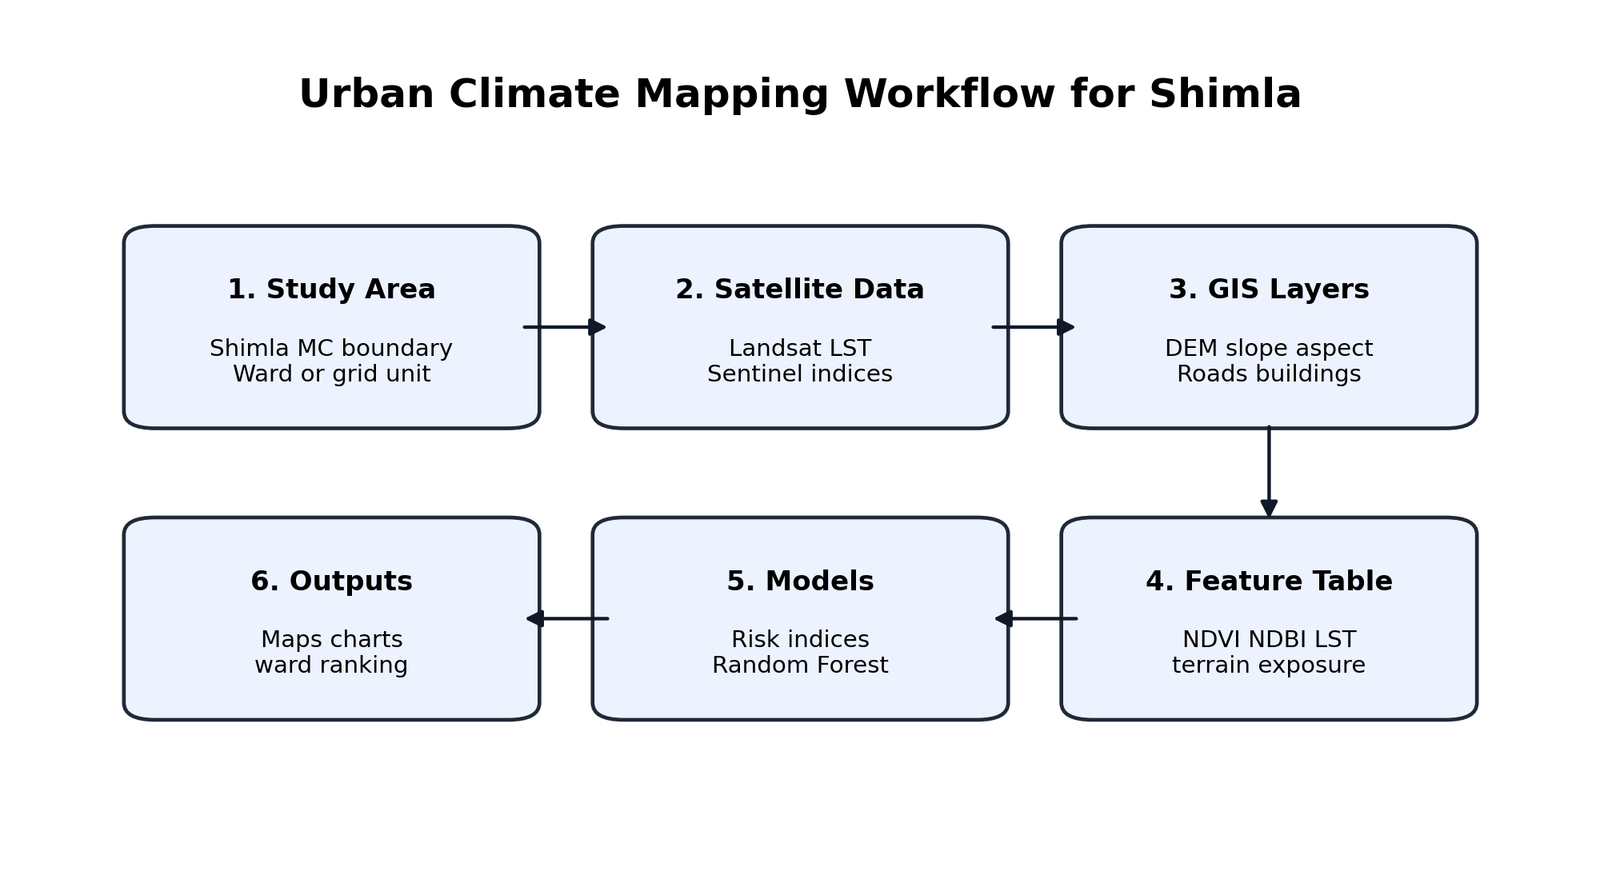
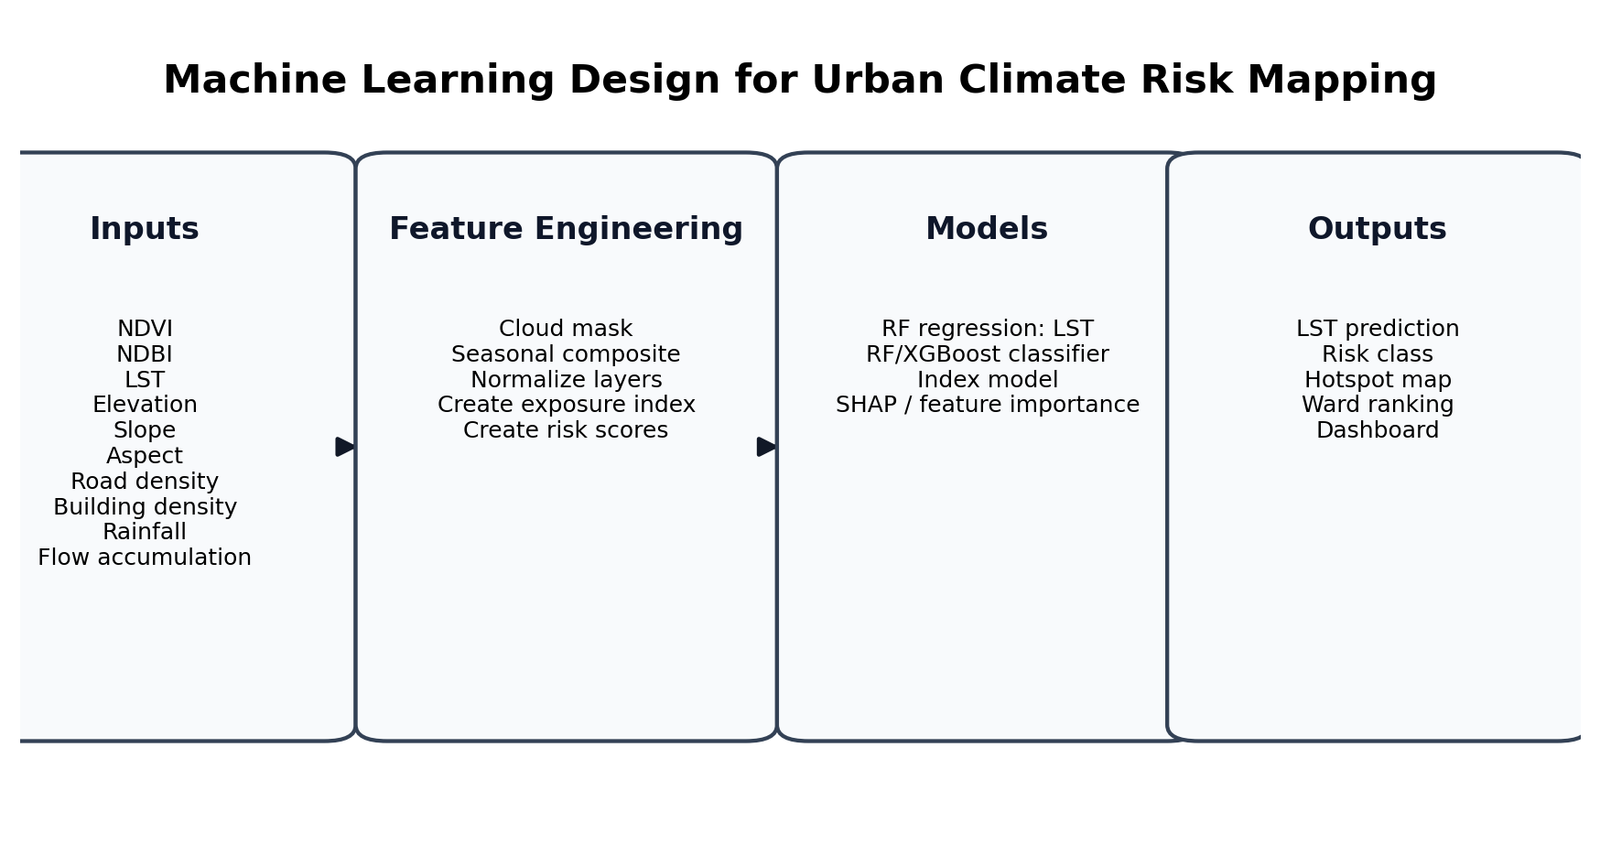
Technical Workflow
The framework integrates Landsat/Sentinel-derived indices, DEM-based terrain layers, rainfall indicators and urban morphology features. A weighted-index and ML-inspired calculation converts these variables into heat vulnerability, cloudburst-impact susceptibility and final urban climate risk.
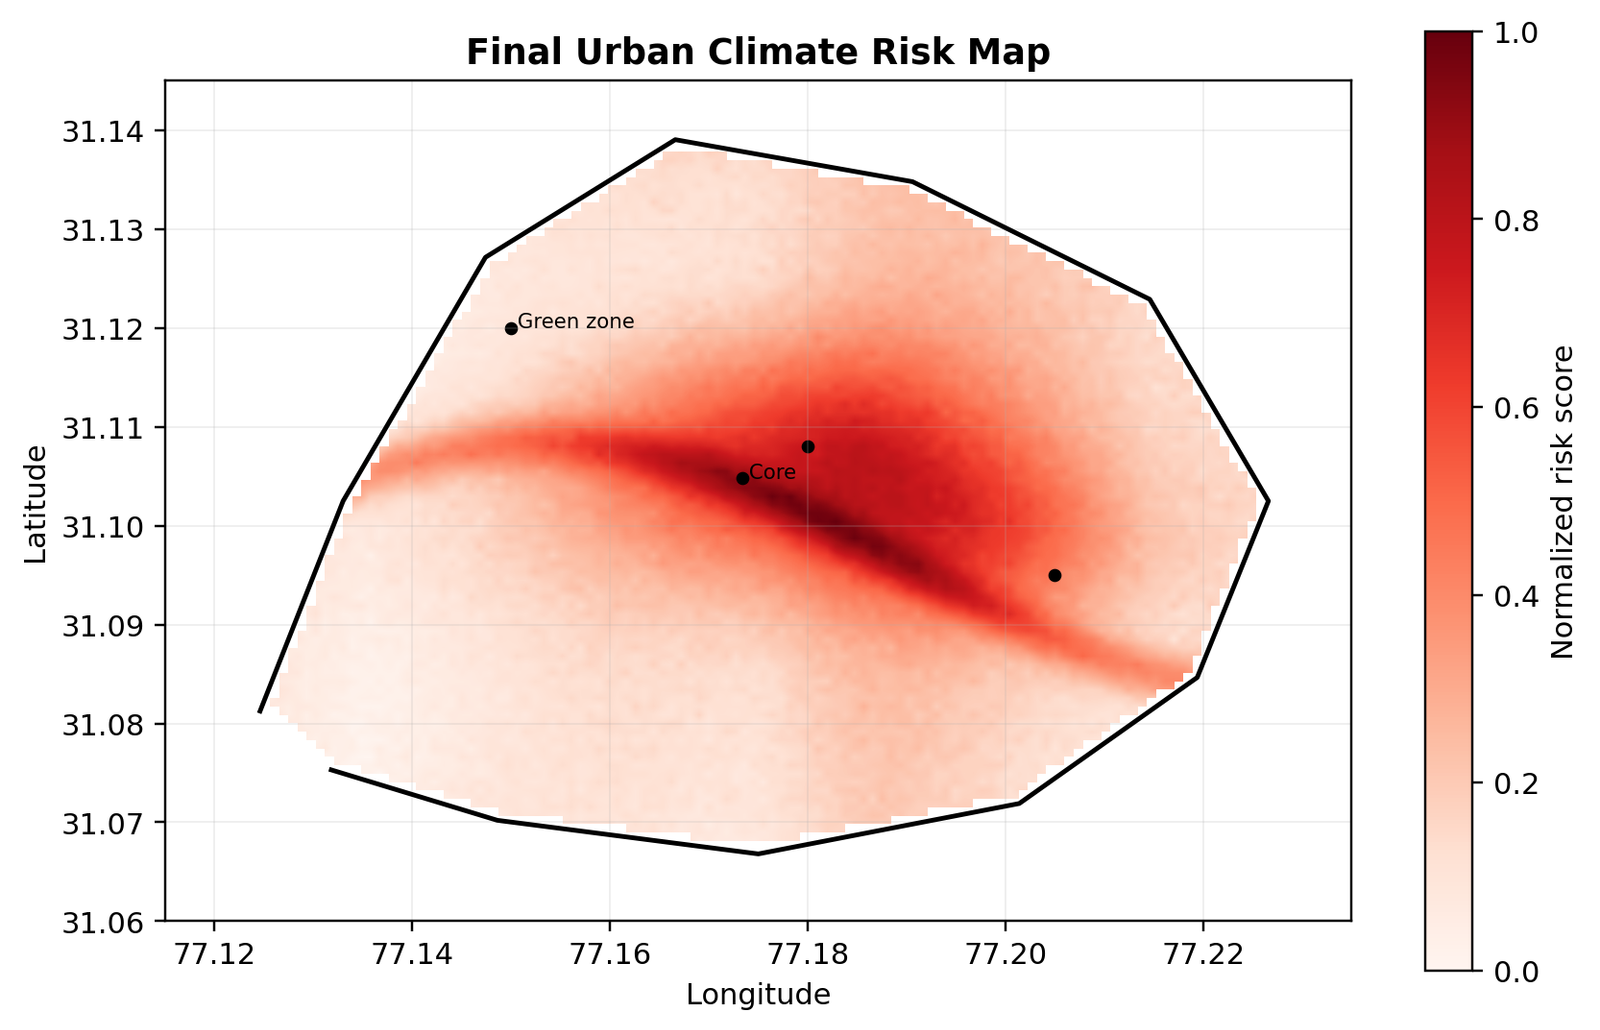
Final Urban Climate Risk
0.45 × Heat Vulnerability + 0.35 × Cloudburst Susceptibility + 0.20 × Exposure Index
Input: NDVI, NDBI, LST, elevation, slope, rainfall, roads, buildings, flow accumulation
Output: Low / Moderate / High / Very High climate-risk classification
Use: Urban climate planning, green-zone prioritization, rainfall-impact preparedness
Interactive spatial layer
Predictive Climate-Risk Points
Click a point to see predicted LST, heat vulnerability, cloudburst susceptibility and final risk class.
Live prediction form
Single-Location Risk Calculator
Change the values and the dashboard will calculate predicted LST and climate-risk class instantly.
Prediction Result
0.00
Predicted LST0 °C
Heat score0.00
Cloudburst score0.00
Final riskLow
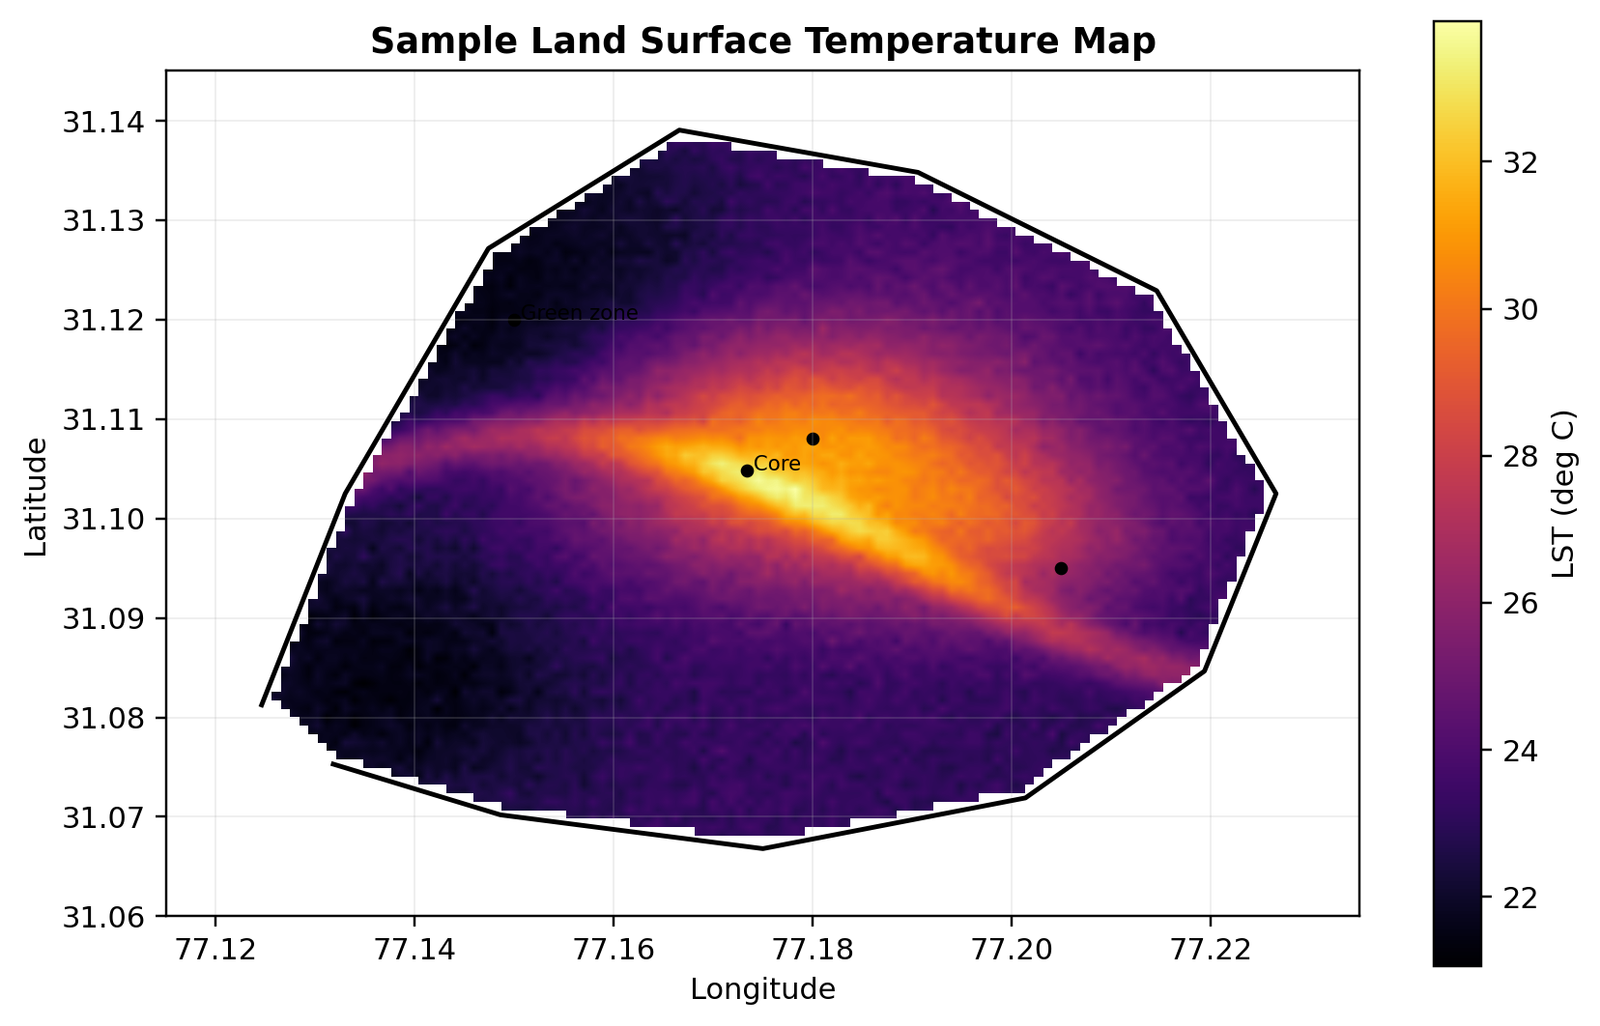
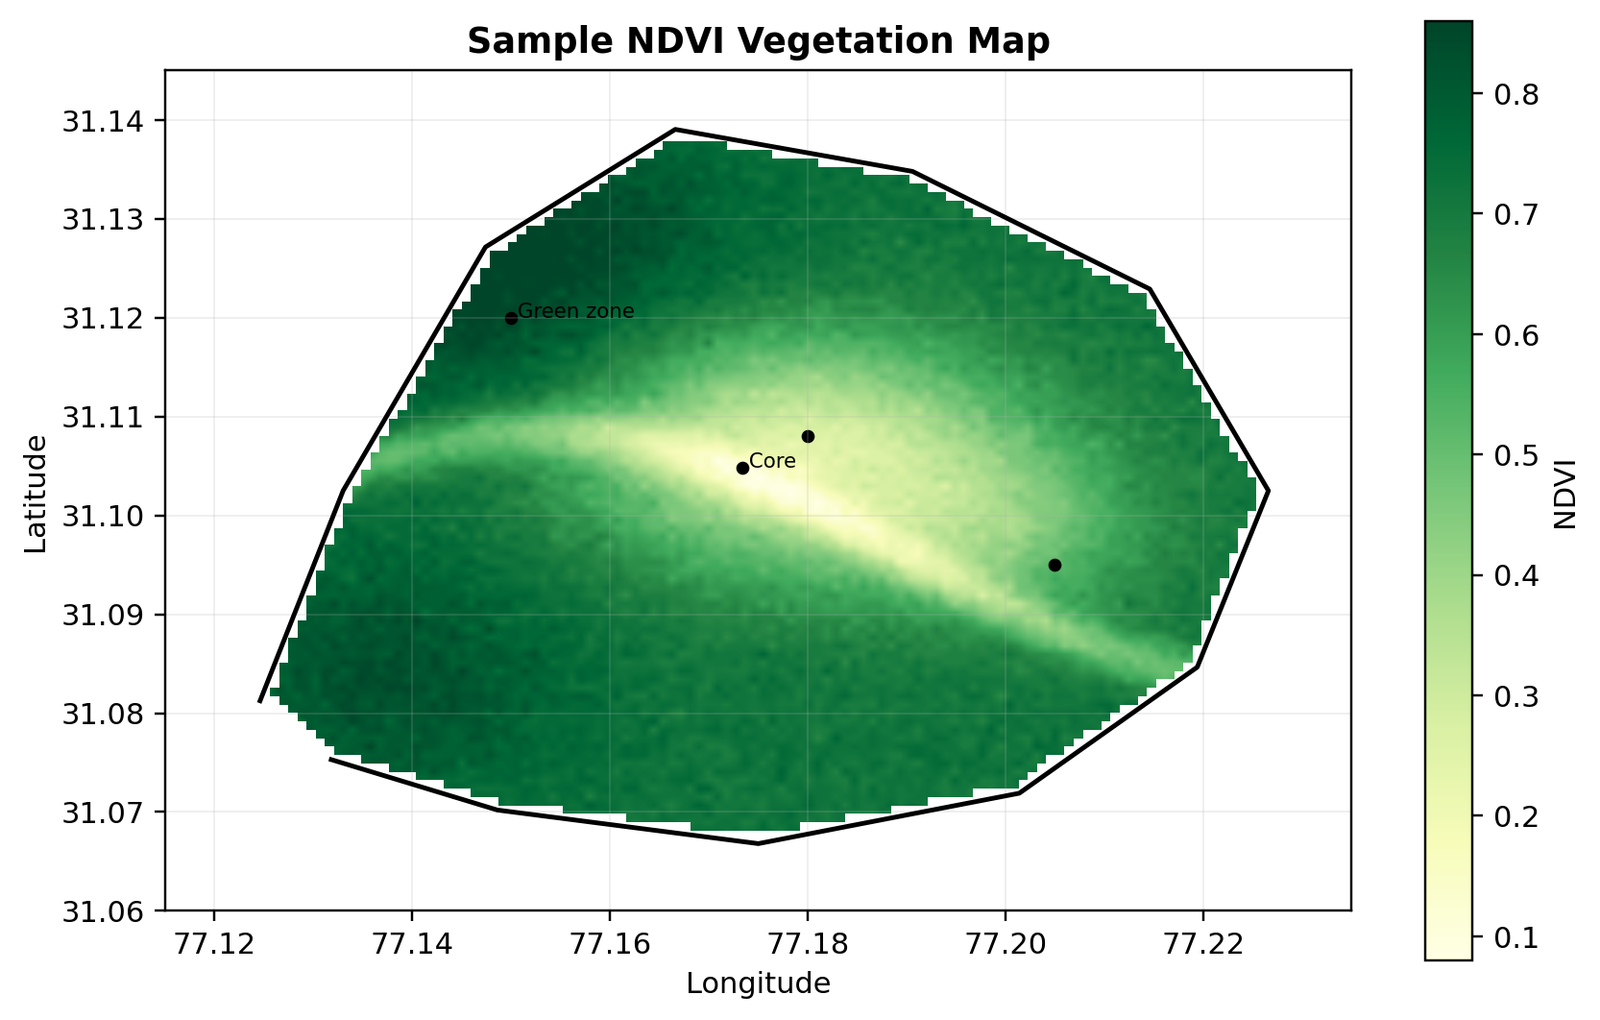
Visual outputs
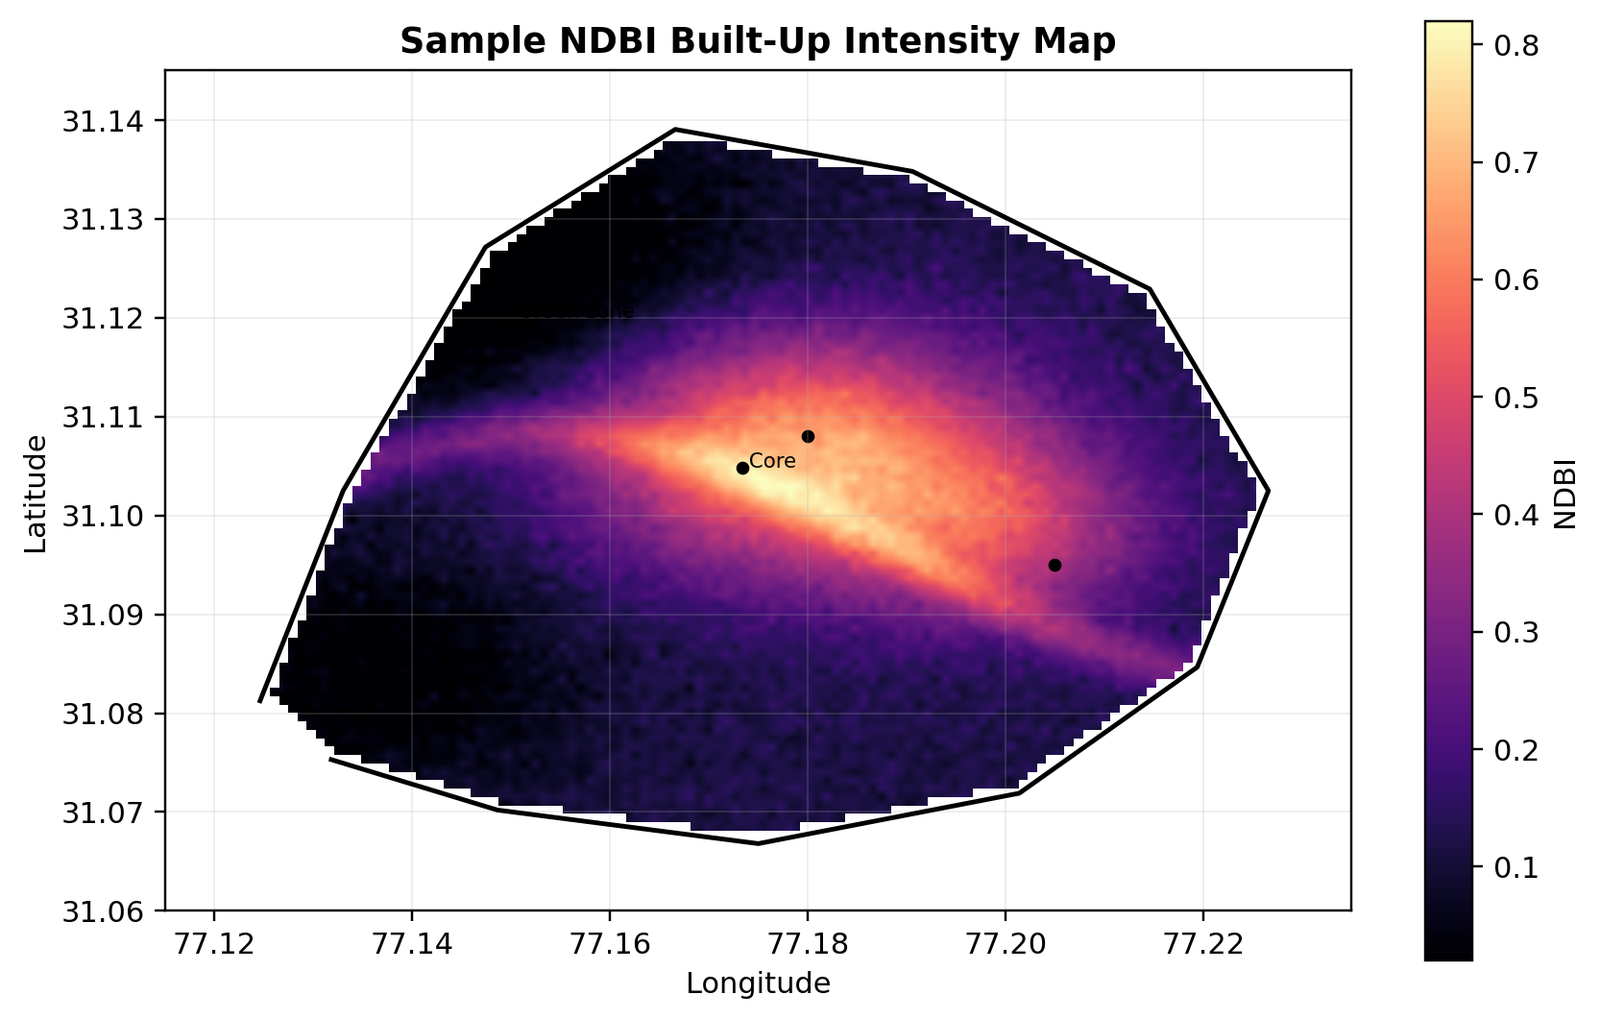
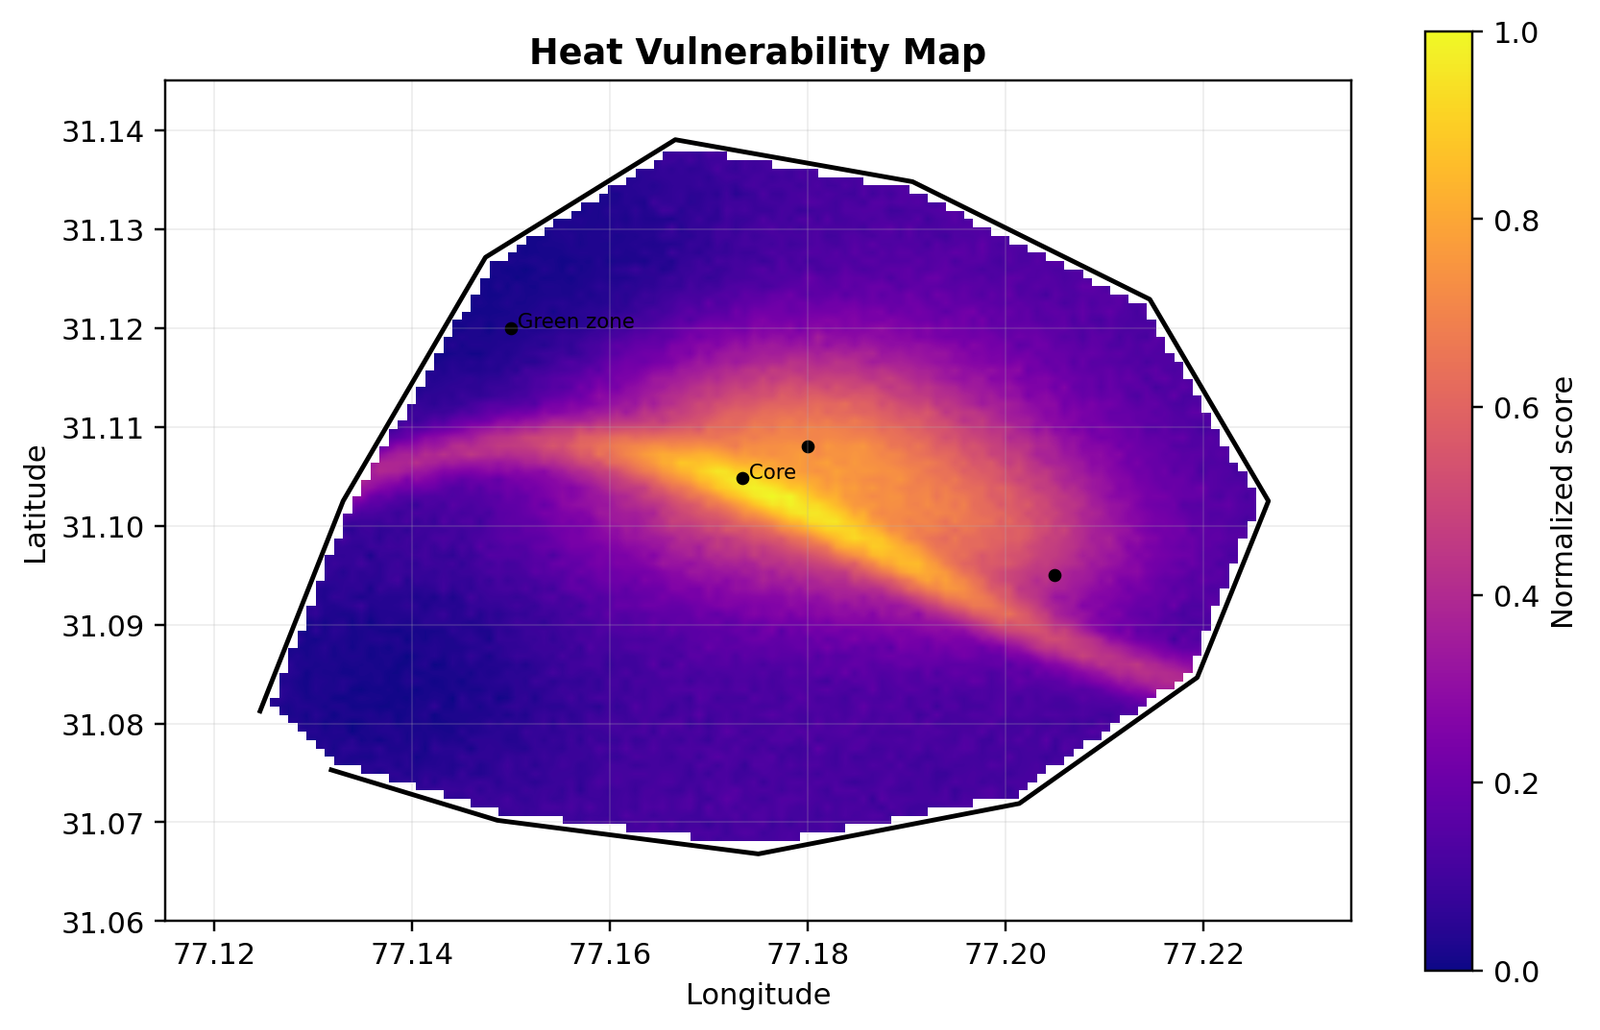
Sample Map Products
These images show the kind of outputs the final research model can generate after real GEE/GIS data extraction.
Use real data
Upload GEE/GIS CSV
Upload a CSV with columns: name,lat,lon,NDVI,NDBI,elevation,slope,road,building,rainfall,flow. The dashboard will replace demo points with your real GIS points.